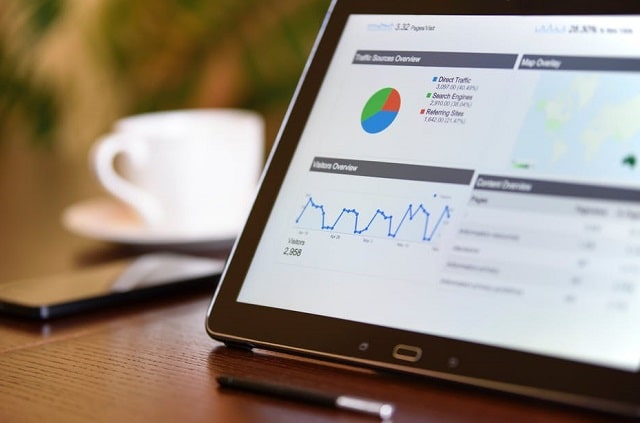
How much do you know about web analytics? While it may sound confusing, it’s actually your secret weapon when it comes to improving your website.
Web analytics metrics is a fancy word for data about your website and its users. Most websites track it through Google Analytics, a free data tool that you can connect with your website.
If you’re new to website metrics, you may be wondering what you should be concentrating on. In that case, keep reading to learn nine key web metrics you should be paying attention to.
1. Page Views
This tends to be one of the first web analytics metrics we think of—we all want to know how many people are visiting our website!
However, keep in mind that page views are not the same as the number of people who visit your site. One person could visit multiple pages within the site, so your page views are usually going to be larger than the number of daily visitors.
Page views are helpful to see which blog posts or pages are most popular within your generally. Generally, the pages that consistently perform the best are likely to be most successful with SEO.
2. Bounce Rate
Bounce rate refers to users who click on your page, and then ‘bounce’ off after only looking at one page. Generally, a high bounce rate is considered a bad thing, as it means your website doesn’t meet the intent of your users.
You can lower your bounce rate by working out which pages are performing the worst—it may be that they need some tweaking, as the information contained on those pages isn’t matching what users are looking for.
3. Audience Demographics
One of the key web metrics is related to the demographics of your website—just who are the people who browse your site each day?
Through audience demographics, you can see a breakdown of your audience’s age, interests, and even what sort of device (such as phone or desktop) they’re using to access your site.
This data is especially important for businesses, as you want to make sure your target demographics are actually the people visiting your site.
4. Location of Audience
When it comes to your audience, you also want to know their location. Otherwise, how can a local business be sure they’re attracting local residents?
Pay attention to the location of your audience—through Google Analytics, you should be able to see the top cities and countries of the people visiting your site. If you’re not getting traffic from the right areas, you may want to spend a bit more time thinking about local SEO and how you can improve your ranking within your city.
Still feeling confused by how to manage your analytics? We can help!
5. Session Duration
Another important web analytics metric is session duration. Essentially, this looks at how long visitors are spending on your site.
Ideally, you want this to be as long as possible, since the longer they spend on your site, the more likely they are to make a purchase. Long duration times are also a good indicator that the content on your site is interesting and of high quality—people want to stick around to see what you have to say.
6. Referral Source
How are users finding your website? By checking out your referral sources, you can learn. A referral source indicates what led someone to your website. Common sources include organic search (meaning your SEO is working), social media, return visitor, or a direct link.
Most websites will have a mix of all of the above, but it’s great data to pay attention to. However, if you see a spike in social media referrals, for example, you may want to look online to see if lots of people have been sharing your content.
7. Sessions
A session is an interaction one person has with your website, from when they first click onto it until they leave. In the interim, they may visit a number of different pages within your site.
It’s useful data to know, as it helps you learn how users are interacting with your website.
8. Exit Pages
What is the final page users visit before they leave your website? Hopefully, it’s a contact or a sales page, meaning your visit has inspired them to take further action.
Or, if customers seem to be placing items into their online cart and then walking away, what is stopping them from making a purchase? If you can figure out where the breaking point is, you can try to fix it so that you don’t miss out on sales. You might even want to remove or redirect certain posts or pages that are causing abnormally high user exits or bounces.
9. Most Popular Pages
It’s great to see which pages on your website perform the best. Over time, you’ll find that certain pages tend to draw in the most traffic. The data doesn't lie!
This could be due to SEO, lots of backlinks, or popularity on social media. See if you can figure out why these pages are successful, and see if you can replicate that formula!
Improve Your Business With Web Analytics
Once you dive into it, web analytics are fascinating. There’s so much you can learn from this data, so it’s worth taking the time to understand.
We recommend focusing on the above factors, as they provide useful data for any business. Take the time to learn more about the analytics data from your website, as you can use it to increase traffic—and profits!
Did you find this article on web analytics that work to be helpful? If so, please keep reading for more great advice. Visit the Tech section of the Frugal Finance Blog right now for additional analytical insights.

